
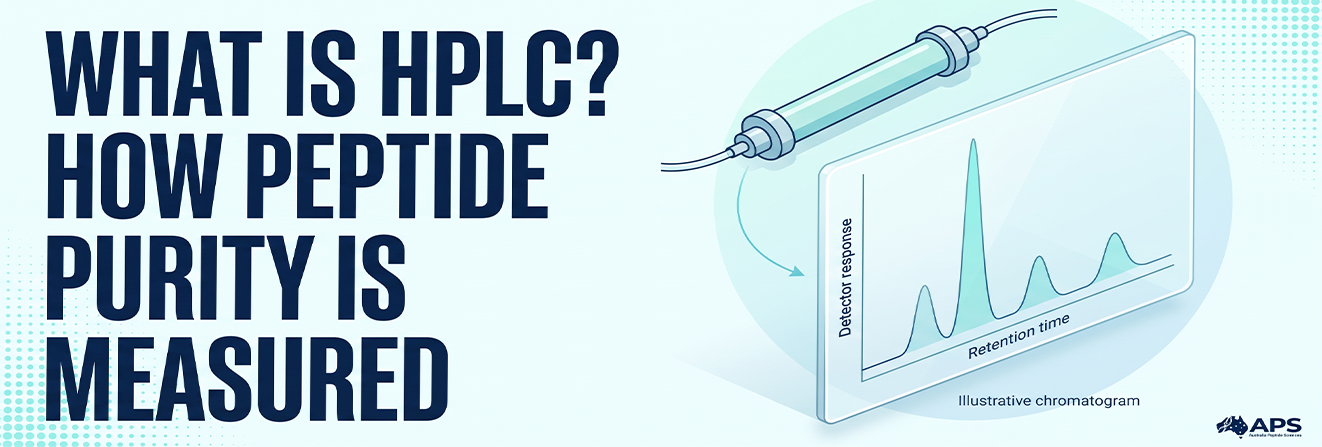
HPLC, or high-performance liquid chromatography, separates components in a liquid sample so laboratories can examine them under defined analytical conditions. In peptide research, it helps reveal the target component and detectable impurities that remain after synthesis, purification or storage.
The result appears as a chromatogram: a record of detector response over time. Understanding that record explains how a laboratory arrives at a purity percentage, why two methods can produce different results, and which questions need additional evidence.
Quick Answer: What Does HPLC Measure?
HPLC separates sample components and records their detector responses. For peptide testing, a common purity result is the percentage of included chromatographic peak area assigned to the target peptide. This is a method-dependent signal measurement. Molecular identity, peptide quantity and other material characteristics require appropriate supporting evidence.
How Does HPLC Work?
An HPLC system moves a liquid, called the mobile phase, through a column containing a stationary phase. The injected sample travels with the mobile phase, while its components interact differently with the stationary phase.
Components retained more strongly generally take longer to leave the column. This exit process is called elution. A downstream detector records the eluting components, and software converts the responses into a chromatogram.
The pump provides the pressure needed to move liquid through the packed column. Pressure alone does not determine which peptides separate; the chemistry of the sample, column and mobile phase controls selectivity.
Analytical chromatography examines a sample to assess its components. Preparative chromatography separates and collects material for purification, further testing or subsequent use.
Main Components of the Instrument
| Component | Function in the analysis |
| Solvent reservoirs and degasser | Supply the mobile phase and remove dissolved gases |
| Pump | Maintains controlled solvent delivery |
| Injector or autosampler | Introduces a measured sample volume |
| Column | Provides the stationary phase for separation |
| Column oven | Controls separation temperature |
| Detector | Measures responses from eluting components |
| Chromatography data system | Records signals and applies integration and reporting rules |
Inconsistent solvent delivery can shift retention times, while unsuitable integration settings can change reported peak areas.
For a visual introduction to the technique, watch the Royal Society of Chemistry’s HPLC overview, which explains the basic principles of high-performance liquid chromatography.
How Does Reverse-Phase HPLC Separate Peptides?
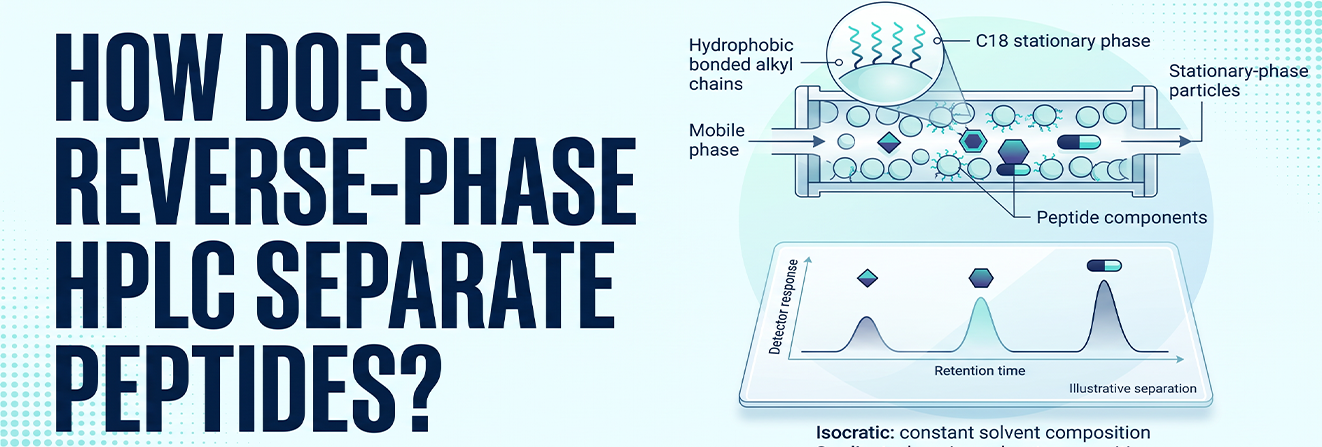
Reverse-phase HPLC, also called reversed-phase HPLC or RP-HPLC, uses a relatively hydrophobic stationary phase with an aqueous-organic mobile phase. It is widely used for peptide analysis because related peptide structures can differ sufficiently in retention to be separated.
Peptide Interactions With the Column
C18 is common, but C8, C4 and other phases can offer different selectivity. Even a short peptide such as KPV requires a method suited to its retention and relevant impurities.
Peptide retention depends on more than chain length. Amino-acid composition, charge, modifications and conformation can influence interactions with the chromatographic system. Mant and colleagues’ review of peptide HPLC methods explains how peptide properties and separation conditions affect chromatographic behaviour.
Stronger hydrophobic interactions often increase retention under comparable conditions. Changing pH, additives or column chemistry can change elution order.
Gradient and Isocratic Elution
In isocratic elution, the mobile-phase composition remains constant during the separation. In gradient elution, that composition changes over time.
Increasing the proportion of an organic solvent such as acetonitrile helps elute retained peptides. The gradient must provide adequate separation and elution.
Deletion sequences, oxidised variants and other related substances may elute close to the target. They are not guaranteed to separate merely because the method uses RP-HPLC. Our peptide synthesis guide explains how manufacturing can introduce related impurities that the analytical method needs to distinguish.
How to Read an HPLC Chromatogram
An HPLC chromatogram plots detector response against time. It shows the recorded separation, rather than a direct inventory of every substance originally present in the sample.
Axes, Baseline and Retention Time
The horizontal axis usually shows minutes after injection. The vertical axis shows the selected detector signal; a UV chromatogram may use absorbance units or milli-absorbance units, abbreviated AU or mAU.
The baseline is the background signal used to measure peaks. Gradient-related drift can complicate integration of small signals.
Retention time is the interval between injection and the maximum of a peak. It helps compare results obtained under controlled conditions, but it is not a universal identifier for a peptide.
Peak Area, Height and Resolution
Peak area is the integrated response above the assigned baseline across a peak. Peak height is the distance from that baseline to the peak maximum.
A narrow, tall peak can have less area than a broader, shorter peak. Area-based purity calculations therefore require integrated areas, not a visual comparison of peak heights.
Resolution describes how well neighbouring peaks are separated. A shoulder beside the main peak can indicate incomplete separation, while two unresolved components may appear as one apparently smooth peak.
Additional signals may reflect carryover, contamination or system effects. Blank injections help distinguish these from sample-related components.
How Is HPLC Peptide Purity Calculated?
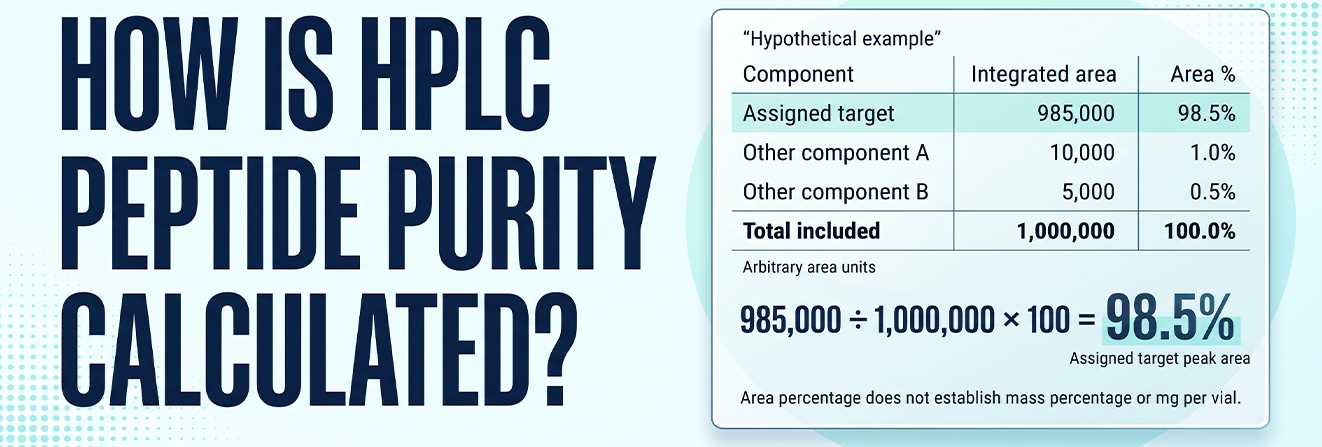
HPLC purity is often reported by area normalisation, which divides the assigned target peak area by the total included peak area. Agilent’s OpenLab glossary describes area percentage as a peak’s proportion of the total integrated peak area.
Target peak area (%) = target integrated area ÷ total included integrated area × 100
Exclude identified solvent or system signals only with scientific justification; do not omit unknown sample peaks to raise the reported purity.
Worked Chromatogram Example
Hypothetical example only; not an APS batch result.
| Peak assignment | Integrated area, arbitrary units | Area percentage |
| Assigned target peptide | 985,000 | 98.5% |
| Other component A | 10,000 | 1.0% |
| Other component B | 5,000 | 0.5% |
| Total included area | 1,000,000 | 100.0% |
The calculation is:
985,000 ÷ 1,000,000 × 100 = 98.5%
The assigned target peak accounts for 98.5% of the included detector response. This does not establish that the target peptide represents 98.5% of the sample’s mass.
For Retatrutide, do not assume the largest peak is the target without identity evidence.
Area Percentage Versus Peptide Content
Area normalisation compares relative signals; calibrated assays use a known reference to measure peptide content.
Validated HPLC can measure peptide content, but area purity alone does not verify milligrams per vial.
Our peptide purity guide explains how chromatographic purity differs from peptide content and other measures of sample composition.
Why Does UV Detection Wavelength Matter?
With UV detection, HPLC measures absorbance at a selected wavelength; compounds can respond differently.
Peptide methods often use 214-220 nm, where peptide bonds absorb. At 280 nm, detection depends more on tryptophan and tyrosine, so peptides lacking these groups may produce weak signals.
Peptides can produce different UV responses at 214 nm. Kuipers and Gruppen showed that amino-acid composition affects molar extinction coefficients, helping explain why equal masses of different peptides need not produce equal peak areas.
UV area percentage is not automatically mass percentage. Quantitative impurity analysis may require standards or justified response corrections.
Report wavelength when interpreting purity.
Explore peptides in Australia for research use only
Why Can Two HPLC Methods Give Different Results?
Different methods can change separation and included signals without either laboratory necessarily making an error.
-
Co-Elution and Selectivity
Two components may overlap under one method and separate under another. If an impurity remains inside the assigned target peak, its response can contribute to the apparent target area.
A synthetic-peptide impurity study demonstrated changes in selectivity with different column and mobile-phase conditions. It illustrates why a single attractive chromatogram is insufficient evidence that every relevant impurity has been resolved.
Diode-array checks can assess peak homogeneity, but similar UV spectra or low impurity levels may conceal co-elution.
-
Integration and Sensitivity
Integration settings determine peak boundaries, baseline placement and which signals are recognised. Raising a peak-detection threshold can remove small signals from the reported total without removing those substances from the sample.
The limit of detection concerns the ability to detect a component. The limit of quantitation concerns the ability to measure it with suitable performance. A visible signal is not necessarily reliably quantifiable.
Before comparing results for Tirzepatide, check the column, gradient, wavelength, integration rules and sensitivity. A small numerical difference alone does not establish a difference in material quality.
What Makes an HPLC Method Fit for Purpose?
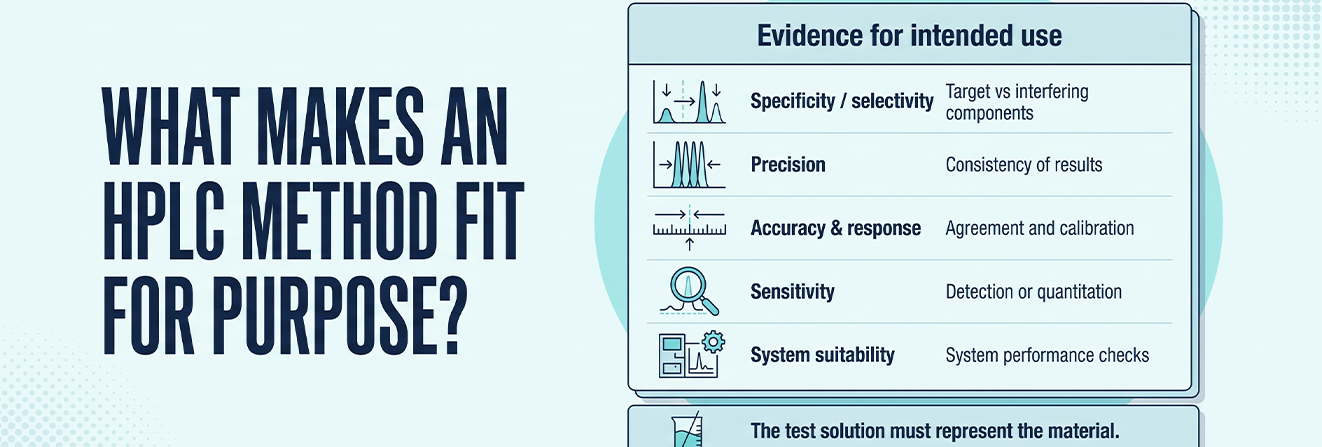
A method must answer its intended question. Repeat injections alone cannot establish adequate impurity separation.
Useful evidence includes:
- Specificity or selectivity: discrimination between the target and relevant interfering components.
- Precision: consistency of results under the conditions being evaluated.
- Accuracy and response behaviour: appropriate agreement and calibration where quantitative results are required.
- Sensitivity: adequate detection or quantitation of the relevant impurities.
- System suitability: checks that the chromatographic system is performing acceptably for the method.
Incomplete dissolution, adsorption or preparation-related degradation can alter what reaches the column; the test solution must represent the material.
For compounds listed in the GLP-1 research category, assess chromatographic behaviour and relevant impurities individually. A shared research category does not mean that the same analytical method is suitable for every compound.
The ICH Q2(R2) analytical-validation guideline supports analytical-performance assessment. It applies to pharmaceutical procedures; citing it does not confer regulatory approval or pharmaceutical status on research materials.
What Are the Limits of HPLC for Identity Confirmation?
Retention time is not unique: different compounds may elute similarly or co-elute.
The ICH Q6A identification guidance notes that retention time alone is insufficient for identification.
LC-MS supports identity assessment by pairing separation with mass-to-charge data, but does not establish every structural feature.
Different sequences, stereoisomers or connectivities can share an intact mass; tandem MS or another structural method may be needed.
HPLC-UV purity does not establish sterility, endotoxin, activity or stability. Water, counterions and residues require separate tests; area normalisation does not describe total sample composition.
How Should HPLC Results Be Reviewed on a Peptide COA?
A certificate of analysis should identify the tested sample or batch. Review the available APS certificates of analysis and match the report’s batch identifier to the material being evaluated. For the HPLC component, examine the supporting chromatogram, reporting basis and method information rather than relying on the percentage alone.
| Detail | Question to ask |
| Sample and batch identifiers | Does this result correspond to the material being evaluated? |
| Method reference and detector conditions | What separation and detection produced the result? |
| Chromatogram and integration table | Which peaks were included, and how was the target assigned? |
| Reporting basis | Is the result area percentage, a corrected result or a calibrated assay? |
| Specification and measured result | Is the acceptance criterion clearly distinguished from the finding? |
If the certificate summarises the result, supporting method information or chromatographic records may need to be requested separately.
Our peptide COA guide explains the wider document review, including batch traceability, reported methods and interpretation of analytical findings.
HPLC Peptide Purity: Interpreting Results in Context
HPLC turns a separation into measurable signals. Interpreting peptide purity requires understanding which components were separated, how they were detected and which areas entered the calculation.
A useful assessment combines the chromatogram with supported peak assignment, appropriate method performance and batch documentation, while keeping purity, identity and peptide content as distinct analytical findings.
Explore Australia Peptide Sciences
Frequently Asked Questions
What does HPLC stand for?
HPLC stands for high-performance liquid chromatography, a technique that separates components in a liquid sample before detecting and evaluating their responses.
How does reverse-phase HPLC separate peptides?
It exploits differences in peptide interactions with a relatively hydrophobic stationary phase and the mobile phase. Sequence, charge, solvent composition and other method conditions influence retention and separation.
How is purity percentage calculated from a chromatogram?
For uncorrected area normalisation, divide the integrated area assigned to the target by the total included integrated area, then multiply by 100. The result describes relative detector signal under that method.
What are the limits of HPLC for identity confirmation?
A retention-time match is not unique structural proof. Co-elution and similar chromatographic behaviour can complicate identification, so suitable mass-related or structural evidence is needed.
Does one HPLC peak mean a sample is completely pure?
No. Multiple compounds may co-elute, and some substances may be undetected or outside the method’s scope. A single peak does not prove the absence of every impurity.
Can purity be calculated from peak height?
Not when the method specifies peak-area normalisation. Height and area are different measurements, and peak width affects their relationship.
Is a 99.9% result necessarily better than 99.0%?
The numbers need comparable methods, reporting bases and suitable measurement performance. They cannot independently establish which material better meets a particular research specification.
Should the same peptide always have the same retention time?
No. Retention time can change with the column, solvent gradient, temperature and other conditions. Meaningful comparison requires an appropriately controlled method.
Does an LC-MS result replace an HPLC purity result?
Not automatically. LC-MS can support separation and identity assessment, but an identity-focused mass measurement does not replace a fit-for-purpose purity measurement or calibrated quantitative assay.
Is a cropped chromatogram enough to verify purity?
A cropped image may omit relevant peaks, integration details or run context. Review the complete relevant chromatographic record and reporting method before accepting the calculation.
Sources
- Mant CT, et al. HPLC Analysis and Purification of Peptides. Methods in Molecular Biology. 2007;386:3-55.
- Kuipers BJH, Gruppen H. Prediction of molar extinction coefficients of proteins and peptides using UV absorption of the constituent amino acids at 214 nm to enable quantitative reverse phase high-performance liquid chromatography-mass spectrometry analysis. Journal of Agricultural and Food Chemistry. 2007;55(14):5445-5451.
- Yang H, et al. Synthetic Peptide Impurity Analysis on Waters Reversed-Phase Columns. Waters Corporation application note. 2018.
- ICH. Q2(R2): Validation of Analytical Procedures. FDA publication, March 2024.
- ICH. Q6A: Specifications, Test Procedures and Acceptance Criteria for New Drug Substances and New Drug Products: Chemical Substances.
- Agilent Technologies. OpenLab Glossary.